If you’ve ever watched the stock market dip and wondered, “Is this normal?”—the answer is yes! Stock market pullbacks, those moments when prices drop from their recent highs, are a regular part of investing. They can feel scary, but history shows they happen all the time. Let’s break down what pullbacks look like and how often they’ve shown up over the last 100 years, based on the S&P 500, a key measure of U.S. stocks.
What’s a Pullback?
A pullback is just a fancy way of saying the stock market takes a step back. Imagine prices climbing a hill, then sliding down a bit before (often) heading back up. We measure pullbacks by how much the market falls from its peak—say, 5%, 10%, 15%, or 20%. Each size tells us something different about what’s going on.
The Small Dip: 5% Pullbacks
A 5% drop is like a speed bump—small and super common. Over the past 100 years, the stock market has hit a 5% dip in about 94 out of every 100 years. That’s almost every single year! Sometimes it happens a few times in one year, like little hiccups. It’s so normal that investors barely blink at it—it’s just the market taking a quick breather.
The Correction: 10% Pullbacks
When the market falls 10%, we call it a “correction.” It’s a bigger dip, like stepping into a shallow puddle. History shows this happens in about 6 out of every 10 years—roughly once every year and a half or so. It’s noticeable, but it’s still pretty routine. Think of it as the market saying, “Whoa, let’s slow down a bit.”
The Deeper Drop: 15% Pullbacks
A 15% decline feels more serious, like sliding halfway down a playground slide. Over the last century, this has happened in about 4 out of every 10 years—around once every 2.5 years. It’s not as common as the smaller dips, but it’s still something investors see fairly often. It might signal tougher times, but it’s not a full-on crisis.
The Big One: 20% Pullbacks
When the market drops 20% or more, we enter “bear market” territory. It’s like tumbling all the way down that slide! This has happened in about 1 out of every 4 years over the past 100 years. These are the big drops that grab headlines, often tied to economic slowdowns or surprises. But here’s the thing: not every 20% drop turns into a long disaster—sometimes the market bounces back by year’s end.
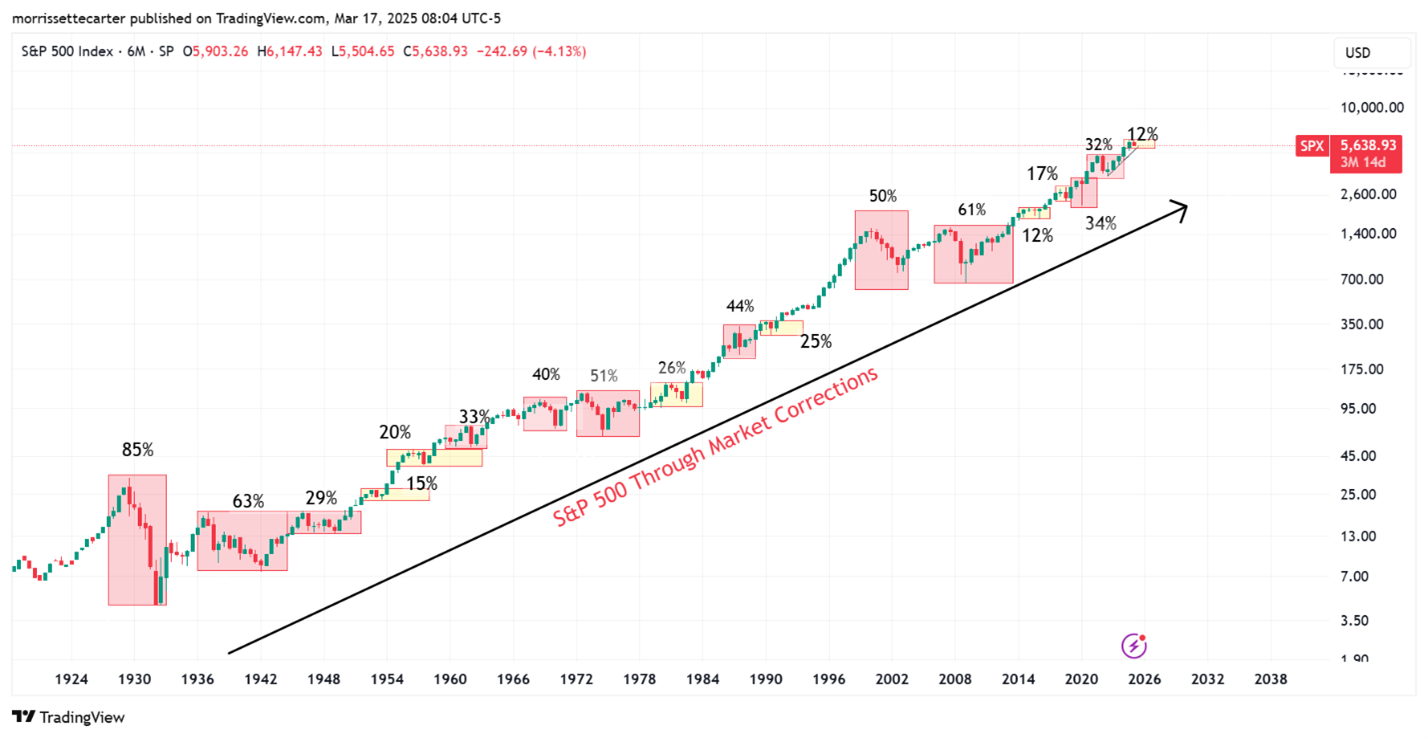
Despite numerous double digit drops, the S&P 500 is up over 19,000% total return going back to the 1920’s
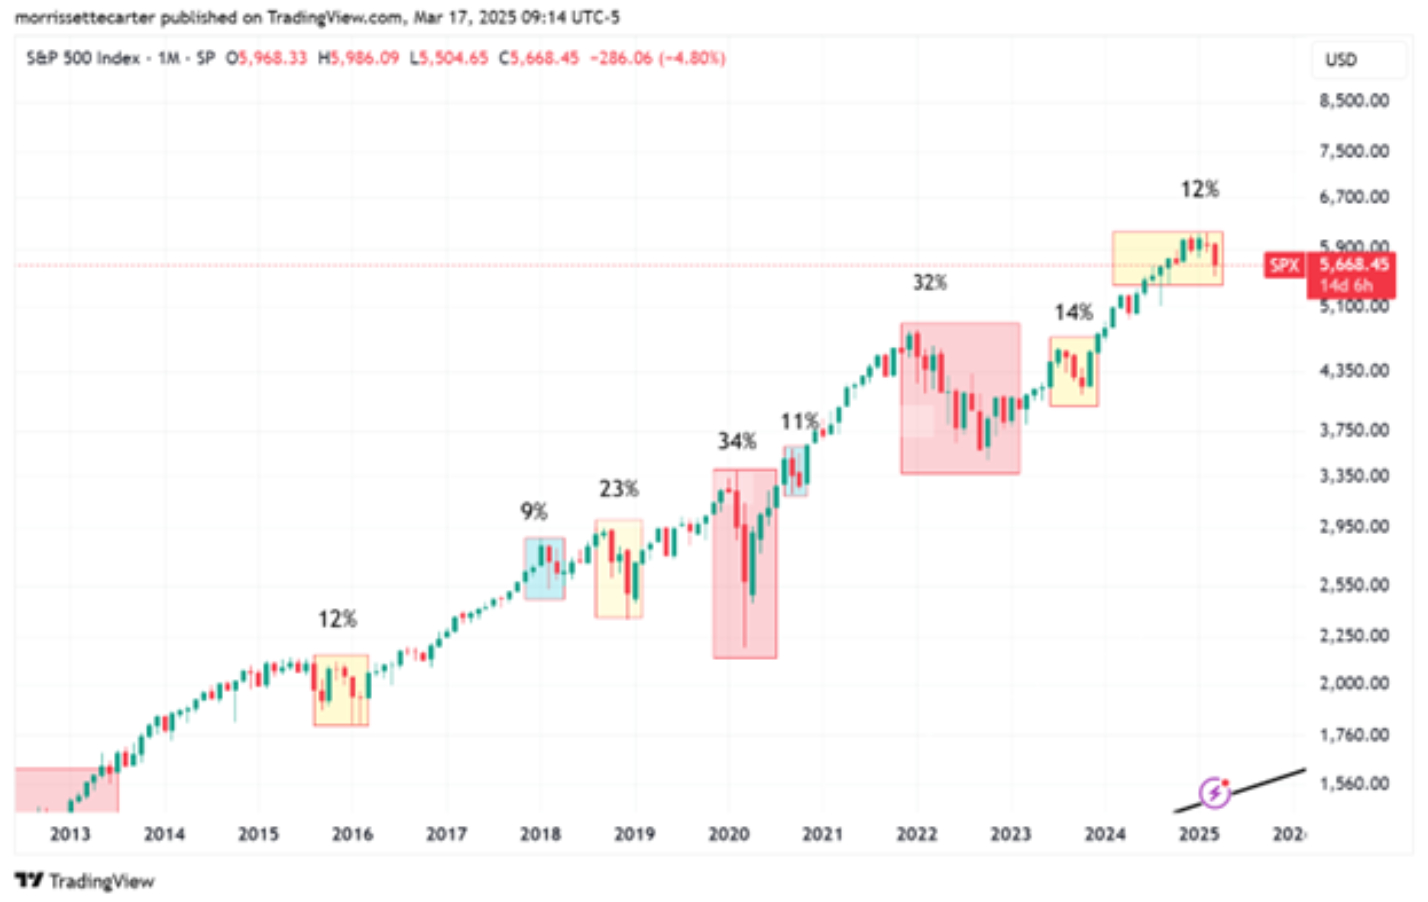
Investors in the S&P 500 over the last decade were handsomely rewarded, but this timeframe also included multiple “painful” pullbacks. They were painful in the moment, but when you zoom out just a little bit, you realize they are part of the price we pay for good long-term returns
Why This Matters
Pullbacks sound bad, but they’re just part of how the stock market works. Over time, it tends to climb higher, even with these dips along the way. Think of it like a hike: there are downhill stretches, but the trail still leads up the mountain. For example:
- A 5% dip? Expect it almost every year.
- A 10% correction? About once every year and a half.
- A 15% drop? Roughly once every 2.5 years.
- A 20% bear market? Around once every 4 years on average.
The Bright Side
These drops can actually be opportunities. When prices fall, it’s like stocks going on sale—great for people who want to buy in and hold on for the long haul. The last 100 years show that after pullbacks, the market often recovers and keeps growing. Sure, big drops like the Great Depression or 2008 stick in our minds, but smaller dips happen way more often and don’t last forever.
Takeaway
Stock market pullbacks are normal, not a sign the sky is falling. Whether it’s a tiny 5% dip or a bigger 20% plunge, they’ve been happening for a century and will keep happening. Knowing how often they pop up—based on this 100-year track record—can help you stay calm and smart about investing. So next time the market wobbles, just remember: it’s probably been here before, and it’ll likely climb back up again. Professional portfolio management can help you stay invested with a strategy built for volatility like this. Contact Berger Financial Group to learn more about why stocks is pulling back.